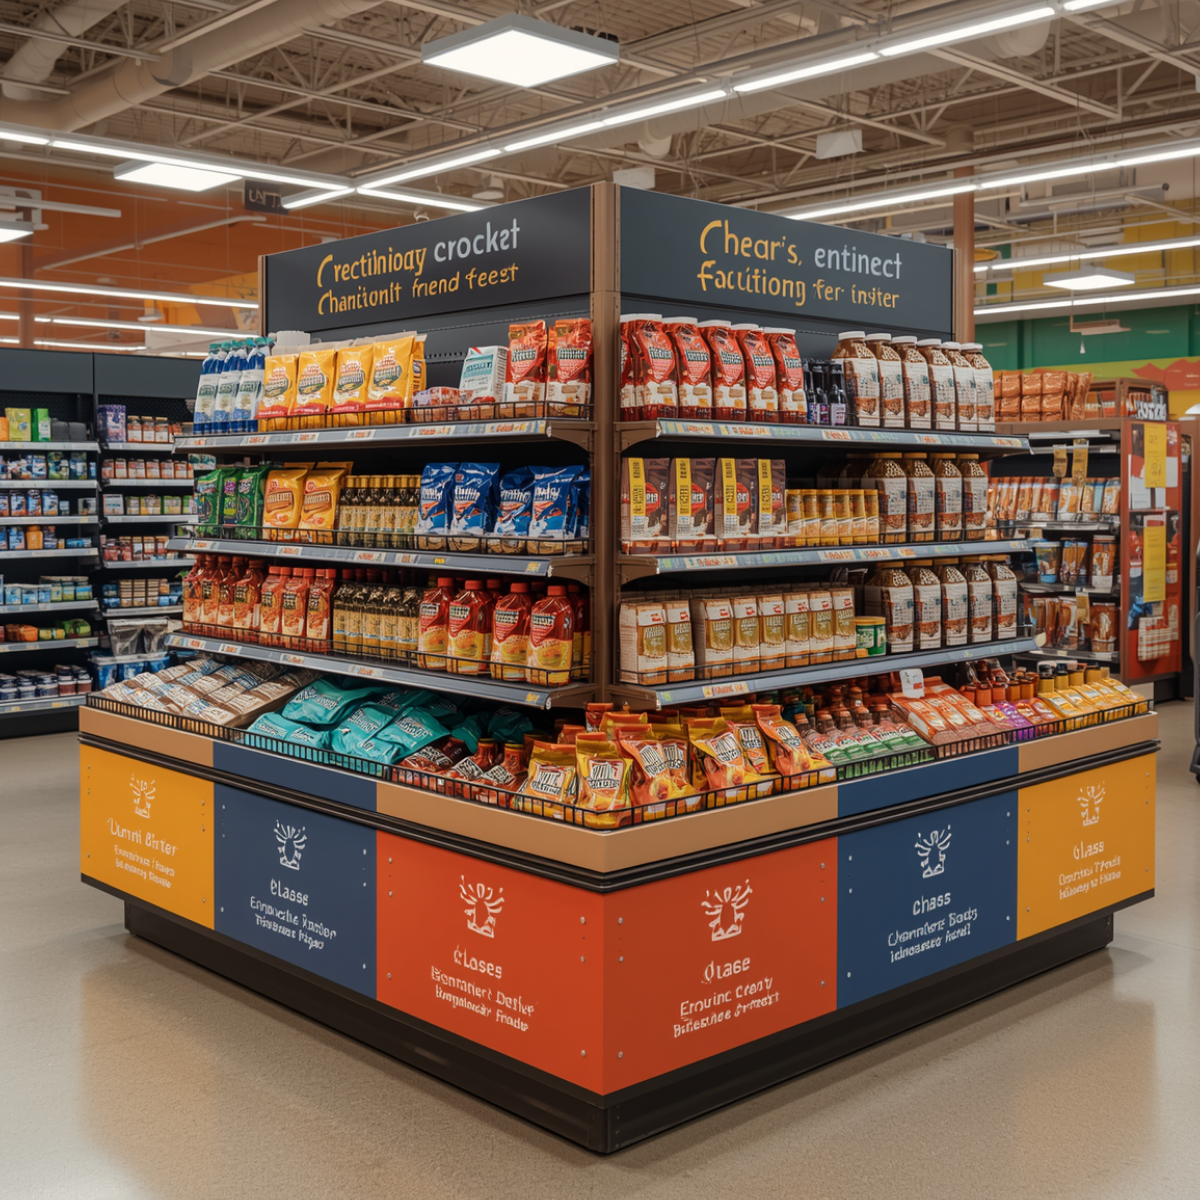
During a promotional period, secondary displays can account for up to 70% of your sales.
Not 70% of your display-driven sales. Up to 70% of total sales. Which means the decisions you're making about placement, design, assortment, and signage aren't peripheral choices — they're core revenue decisions. Most brands are making revenue decisions based on incomplete information.
Here's the question you should be asking before your next campaign: Do I actually know which of my displays are working — and why?
Not which ones correlate with a lucky sales bump...Which ones truly drove impact? Which inspired shoppers to stop, engage, and buy — and which ones are burning floor space as a mere roadblock while you pay for them?
These questions require behavioral evidence to close the gap. Read on to discover how to close that gap and uncover shopper behavior insights—your blueprint for smarter secondary display performance and category growth.
Stop Counting Foot Traffic. Start Optimizing for Productive Traffic.
The most persistent myth in secondary display placement strategy is that placement is a function of foot traffic. The thinking goes: “Put the display where the most shoppers walk past. More exposure will equal more conversions!
It might sound intuitive. It's also frequently incorrect.
Traffic volume and traffic productivity are not the same thing. A shopper moving through a high-traffic zone on a focused trip mission — head down, phone in hand — isn't actually available to be influenced by your display, no matter how well-executed it is. What happens when the shopper is physically present, but behaviorally absent? In truth, not much.
The display that looks well-positioned on a store map is often outperformed by one in a lower-traffic zone where shoppers are naturally slowing down, browsing, and open to discovery that complements their mission.
That’s why traffic counts are a starting point, not a metric of success. What matters most is not how many shoppers walked past your display – but what happened in that micro-moment opportunity for influence? Glance rates, dwell time, physical product interaction, new shopper paths to the primary aisle, conversion: these are the metrics that tell you whether a placement is influencing or just visible.
What About Attribution Modeling?
Let’s say a shopper actively stops and assesses your secondary display — warm beer, large pack sizes, seasonal variety assortment, good signage. They stop, they look, they don't pick anything up. By most measurement frameworks, that's a miss.
But watch what happens next. They turn around and walk directly to the refrigerated beer aisle and put a six-pack in their basket.
Your display worked. You just didn't see it.
Secondary displays don't only drive direct, off-display conversions — they function as triggers. They interrupt autopilot. They surface a need the shopper wasn't consciously carrying, which goes on to be fulfilled elsewhere in the store.
In some cases, if your attribution model only counts the sales that happen off the display, you're systematically undercounting its value. The behavioral question isn't just whether they buy from the display. It's what the display causes them to do next.
The Metrics You Should Be Tracking (But Probably Aren't)
If your performance framework starts and ends with sales lift, you're measuring the outcome without understanding the mechanism. Sales lift tells you what happened. It can't reliably tell you why – or what to do next.
Consider what you can uncover when looking through a behavioral lens:
-
Glance rate - What percentage of shoppers who pass your display actually look at it?
-
Engagement rate - Of shoppers who glance, how many interact — pause, reach, examine? This is where assortment, pack size, signage and display scale start to reveal their influence.
-
Conversion rate - Of engaged shoppers, how many buy? High engagement and low conversion usually point to a messaging or pricing disconnect — something fixable, if you know it's there.
-
Shopper profiles - Who is your display actually reaching? In one case, a smaller pack size beverage display dramatically outperformed with female shoppers, driving +155% display conversions. That doesn't show up in a sales report. It shows up when you start looking and listening.
Collectively, these metrics give you a starter model for a fact-based attribution model — a precise picture of which display configurations, in which locations, featuring which categories, are actually driving results.
From Campaign to Playbook
The goal isn't to run a better promotion today. It's to build a body of behavioral knowledge that makes every future promotion better - because all campaigns are grounded in shopper truth. Secondary displays are one of the highest-leverage tools you have. The question is whether you're learning from them.
VideoMining's in-store market research services give you the inside scoop, the behavioral benchmarks, and the tactical playbook to find out.

Explore More Content
Popular Articles