


Overview: This blog explains how shopper insights and behavioral shopper insights help retailers understand the full path to purchase beyond sales data. It covers key metrics such as aisle exposure, category exposure, engagement, closure rate, and Shoppability Score to identify where shoppers drop off, why category performance declines, and how retailers can make more informed merchandising and category strategy decisions.
If you're only measuring what sold, you're missing most of the story. Sales data tells you the outcome — it can't tell you where in the shopper's journey things actually broke down, or why. That's the gap fact-based funnels and shoppers insights are built to close.
The problem with sales-only measurement
Traditional category analytics start and stop at the register. But by the time a sale (or a missed one) shows up in the data, the moment that actually decided it — a shopper scanning a shelf, hesitating, walking past, or walking away — is long gone. Without behavioral shopper insights, that moment is invisible, and category teams are left guessing at the root cause.
The path to purchase, measured in five layers
Behavioral shopper insights map the full journey — Store Traffic, Aisle Traffic, Category Traffic, Category Shoppers, and Category Buyers — connected by conversion rates that turn a vague "sales were flat" into a specific, diagnosable answer:
-
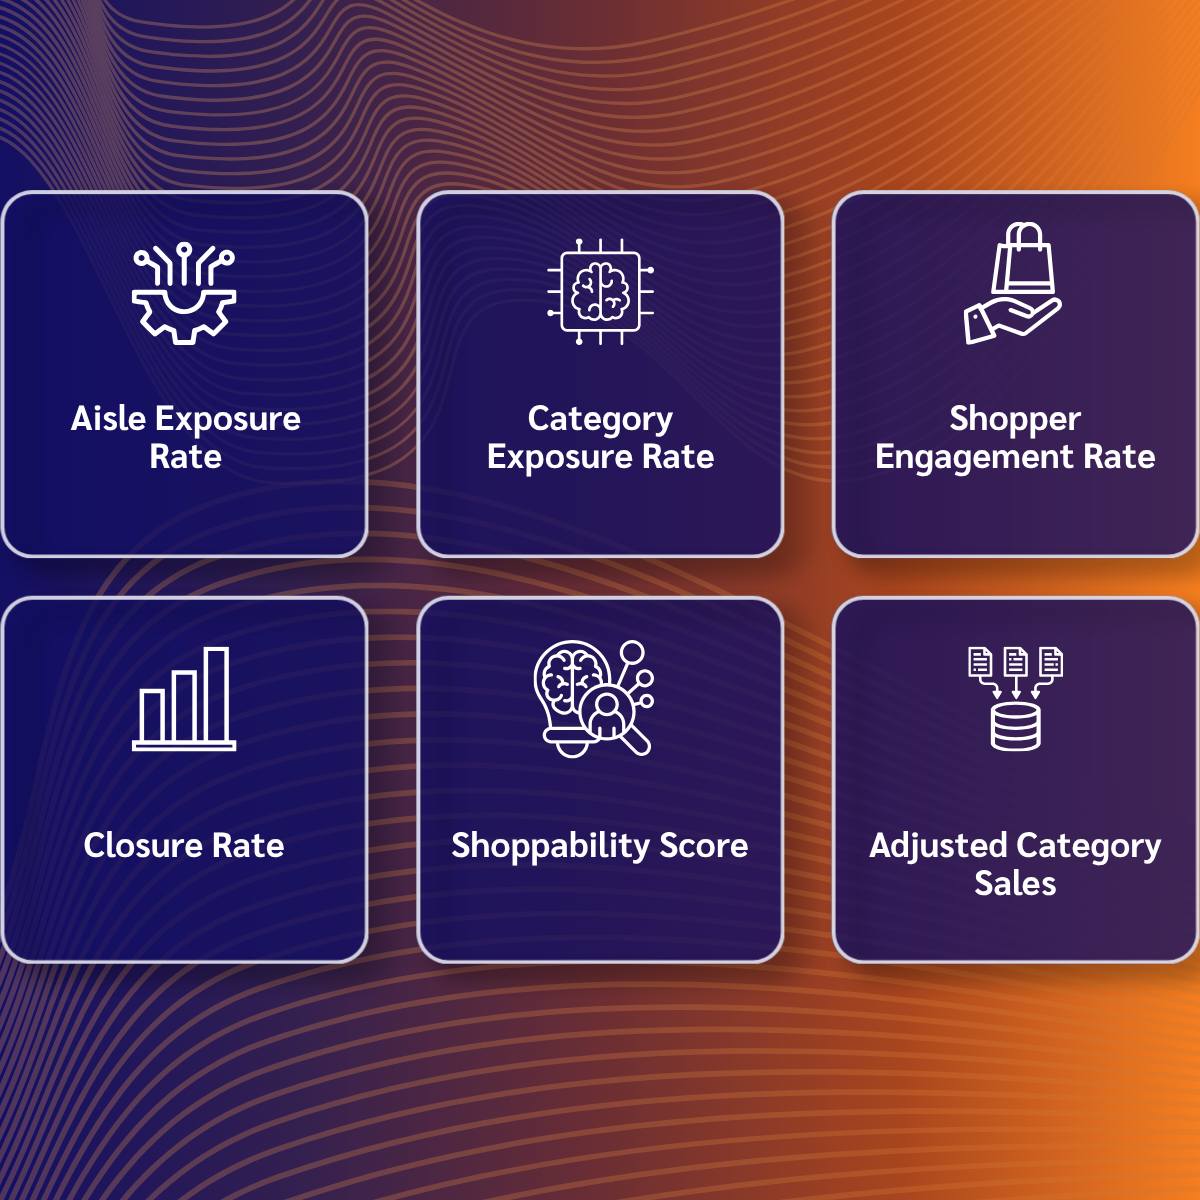
Aisle Exposure Rate — are shoppers even walking past the category?
-
Category Exposure Rate — are they reaching the shelf itself?
-
Engagement Rate — are they stopping to actually shop it?
-
Closure Rate — are they converting, or walking away empty-handed?
Each rate isolates a different failure point. A weak closure rate with strong engagement means something different — and needs a different fix — than weak engagement with strong exposure.
The metric most teams are missing: Shoppability Score
The ratio of active shopping time to total engagement time within a category, Shoppability Score is a leading indicator: it moves before closure rate drops, and long before it shows up in sales. A low score means shoppers are searching, not choosing — a direct, measurable signal of layout confusion, well before quarterly numbers confirm it.
What this looks like in practice
In one grocery retailer's evaluation of category resets, adding these shopper insights and behavioral metrics to the scorecard told a different story than sales data alone: 39% of reset decisions were quietly underperforming — worth over $150 million in annual revenue once corrected. That's not a data problem. It's a measurement problem, and it's fixable.
Shopper truth isn't a philosophy — it's a balance sheet
Measuring exposure, engagement, closure, and shoppability replaces guesswork with a fact base that shows exactly where a shopper was lost, and what to fix. That's the return on metrics that matter: a category strategy built on what shoppers actually do, not what the sales data left you to assume.
Get the full breakdown of every metric — what it is, why it matters, and how to use shopper insights — in our white paper, Path to Purchase: Leveraging Metrics That Matter.

Explore More Content
Popular Articles


.png?width=352&name=image%20(6).png)

%20(1).png?width=352&name=1%20(7)%20(1).png)