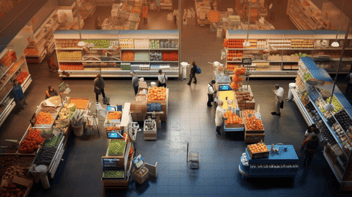
There has been a gradual decline in displays since 2017, with the grocery channel losing 10 displays per store over the past 5 years [IRI]. As display space continues to be challenged, and as shopper behavior continues to evolve to current market conditions, retailers and manufacturers continue to seek robust methods of evaluating merchandising strategies.
With fewer opportunities to play with, marketers must be intentional in planning and executing display strategies, with particular emphasis on reducing waste and maximizing return. Key questions arise as retailers and manufacturers seek to develop a winning formula to maximize in-store display effectiveness:
What items should be included on the display?- Making the decision on which categories to include can feel like a guessing game, even before you have to factor in detailed decisions around pack sizes, LTOs, promotions, etc. to include.
How should the message be communicated?
- Today’s shoppers are more discerning, both with their time and with their wallets. To create a show-stopping display that inspires and breaks through the existing trip mission, manufacturers and suppliers need to find the right words and images to win hearts and minds, and find their way into the basket.
Where should the display be located?
- There are fewer in-store opportunities for secondary displays, as we continue a five-year decline on average display opportunities at grocery stores.
- Displays in the right location can drive traffic to a particular area, encourage impulse purchases, enhance the shopping experience, provide space for secondary stock outs on high velocity items such as beer and hard beverages, and more.
Display Optimization Strategies Require Quantitative Behavioral Feedback from Shoppers.
A winning display playbook is rooted in metrics that help analyze and predict impact under different in-store conditions. These metrics include:
- Exposure Rate: Measures what percentage of store traffic actually passes by the location. This is key to quantify the value of a store zone and the potential shopper reach you can achieve.
- Engagement Rate: Measures a display’s “stopping power”, meaning the rate at which actual shoppers who walk by take an interest in the display. Engagement Rate can vary based on category/products displayed, along with a display’s location. A/B testing can help uncover the true stopping power to strengthen your placement, product, and message.
- Relative Directional Traffic Flow: Let’s say a shopper sees a summer display with hot dog buns, ketchup, mustard, and chips. How often does that display stop the shopper in their path, and motivate them on a new path towards the hotdogs aisle? This metric answers just that, determining the traffic dynamics in relation to a promoted item’s primary stocking location (for example: condiments), or the location of a complementary category (hot dogs).
- Conversion Rate: Tells us the rate at which engaged shoppers add an item from the display to their basket. This is impacted by the product, package, price, and the level of impulsivity of a category. This is a useful benchmark that marketers should establish by category to drive total store impact.
Actions Speak Louder Than Words
At VideoMining, we’re passionate about unlocking insights around the actual behaviors of shoppers. We look beyond what shoppers say they’ll do, or report back they did, to analyze the most raw and true version of evidence: their actual actions and behaviors. This provides a one-of-a-kind perspective that is rooted in fact, not theory.
.png)


.png?width=352&name=1%20(9).png)

