From Blind Spots to Brilliance
-

 Retail Innovation
 -

 Shopper Experience
 -

 Category Management
 -

 Shopper Marketing
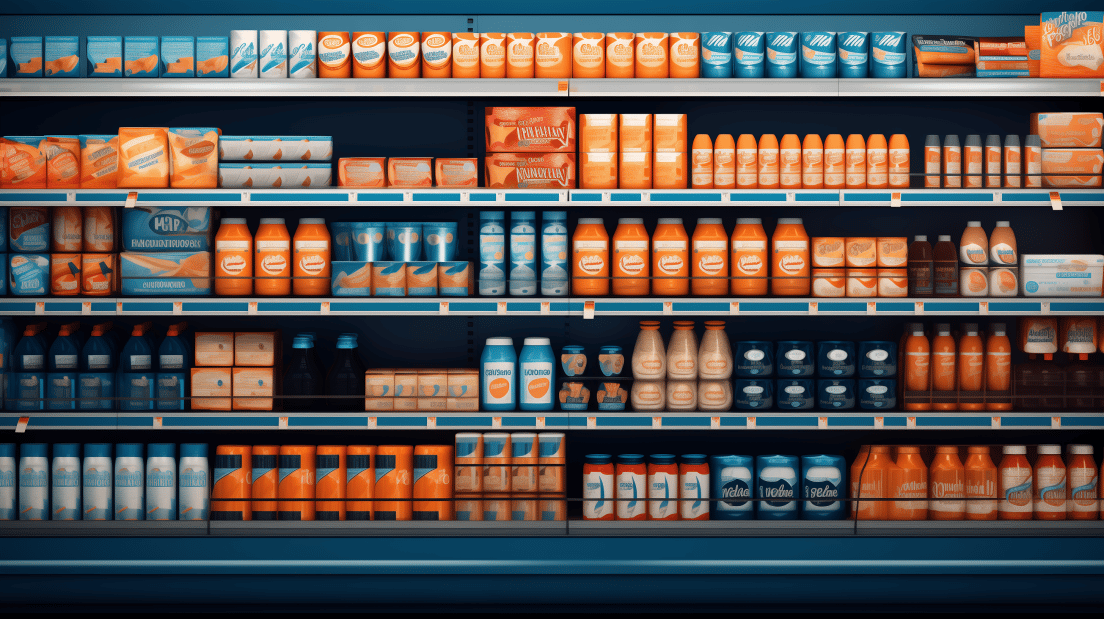
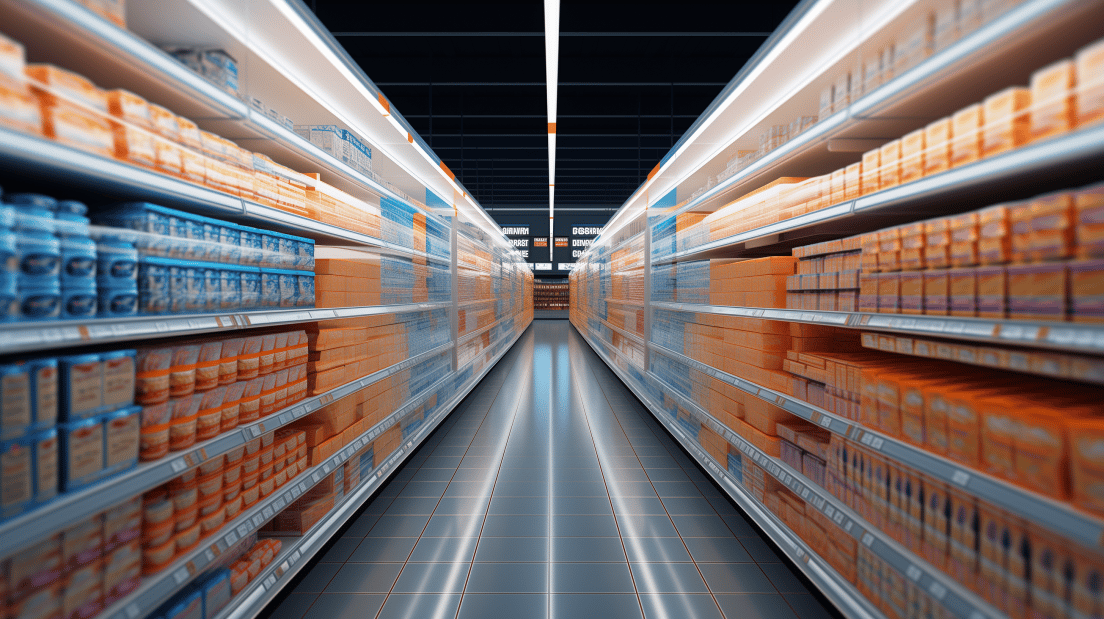
Retail Innovation : Our Offerings
Root your store design decisions in empirical evidence and behavioral science with VideoMining’s Retail Innovation Solutions.
Whether you're building an entirely new store model or updating elements of your existing stores, look to shopper behavioral science to identify must-win moments and experiential elements to infuse in your design principles.
Elevate your space planning process with an evidence-based approach that considers how your shoppers navigate your aisles and make decisions at the shelf.
With VideoMining’s AI-powered retail analytics and shopper behavioral insights, you unlock a fact-based approach to boosting customer engagement and increasing productivity of aisle configurations, adjacency decisions, and traffic flow.
The right merchandising solutions can motivate shopper behaviors towards desired outcomes.
Build comprehensive strategies rooted in a deep understanding of shopper behavior so you can confidently invest in the most meaningful solutions.
Build front end strategies rooted in behavioral analytics to diagnose and address challenges in layout and configurations, test queue and SCO solutions, and increase impulse sales on front end items.
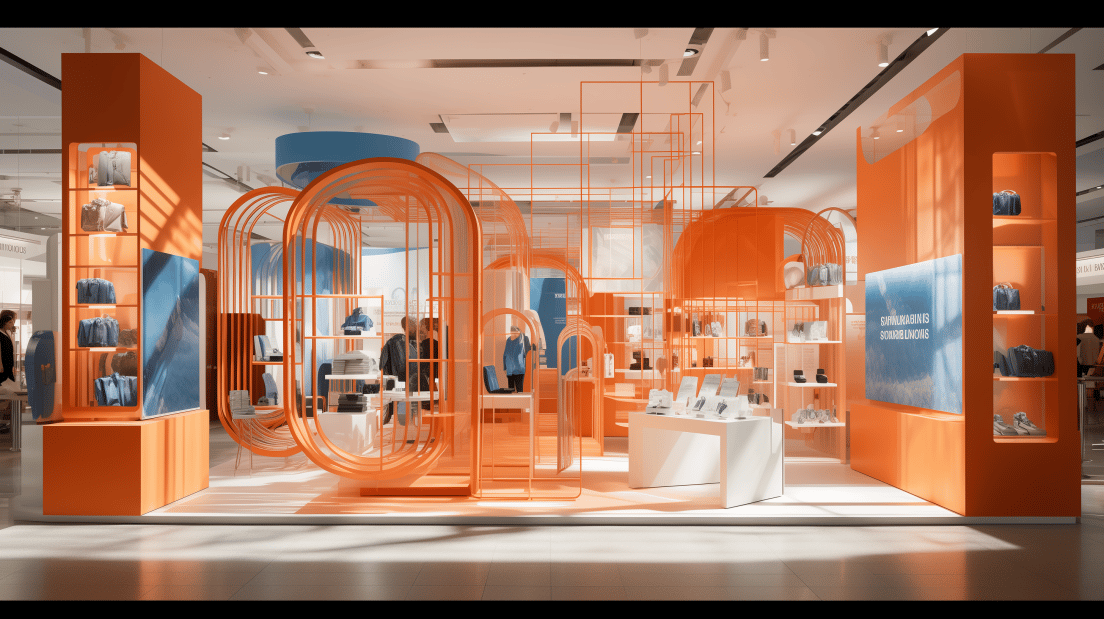
In today's omni-channel environment, the opportunity to create essential "destinations" within your store concept can lead to more meaningful in-store experiences and stronger customer loyalty.
Identify the optimal experiences and destinations that will compliment and support your stores' growth, and identify best practices on destination integrations and experience designs.
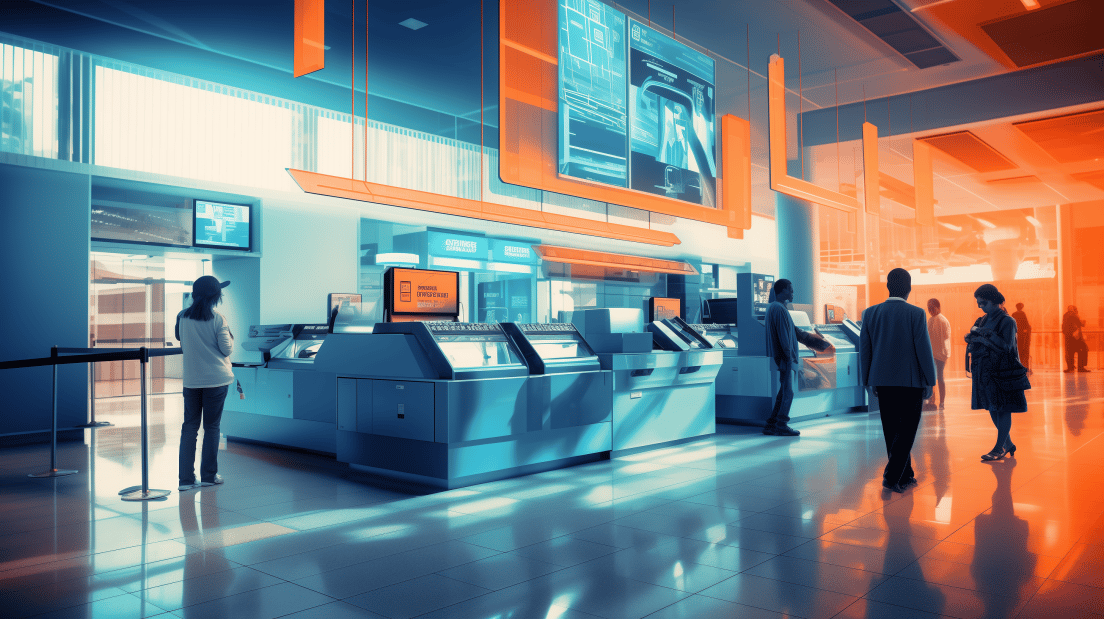
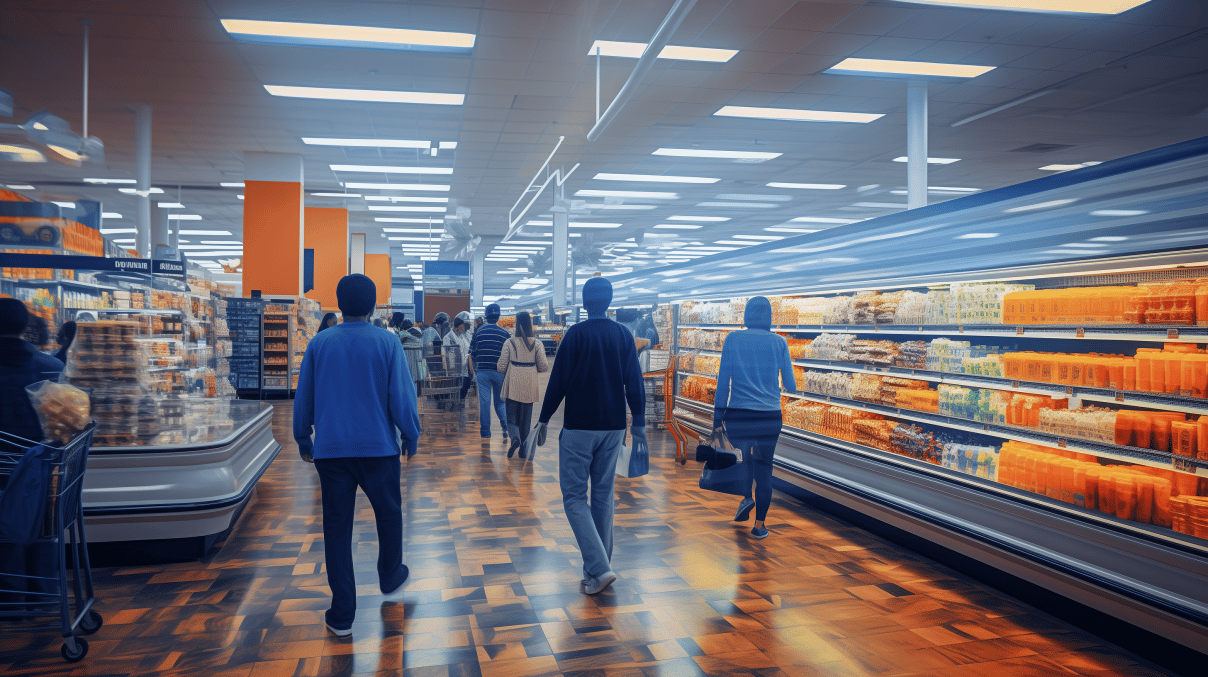
Shopper Experience : Our Offerings
Every single step, pause, re-route, and U-turn tells a story when examined at scale across tens of thousands of trips.
Our AI sensors and data decoding technology capture insights every tenth of a second, providing the kind of detailed traffic flow patterns, heat maps, and route analysis that is impossible for human comprehension alone.
Contextualize the behaviors exhibited by your shoppers during specific trip missions to uncover powerful opportunities to cement basket building opportunities, enhance customer experiences and build winning growth strategies.
Discover how your shoppers intuitively shop your store, navigate your aisles, and expect to find products organized at the shelf. Identify hidden frictions within your store experience with VideoMining's shoppability scoring capabilities that leverage proprietary metrics including at-shelf win rates and customer experience scoring.
Bring a big picture perspective to conversion metrics with VideoMining's deep learning models that look holistically at shopper behaviors in the exact moments that can make, or break, a conversion.
Dissect and diagnose missed sales opportunities by examining the stimuli encountered in the exact moment of choice that led to the shopper walking away empty handed.
VideoMining's AI-powered observational research provides retailers with a panoramic perspective of the impact of each micro-moment of the store experience. From frictionless self-checkout designs, to customer service and experiential design, VideoMining offers unique empathy building intelligence that unlocks winning retail solutions.
Category Management : Our Offerings
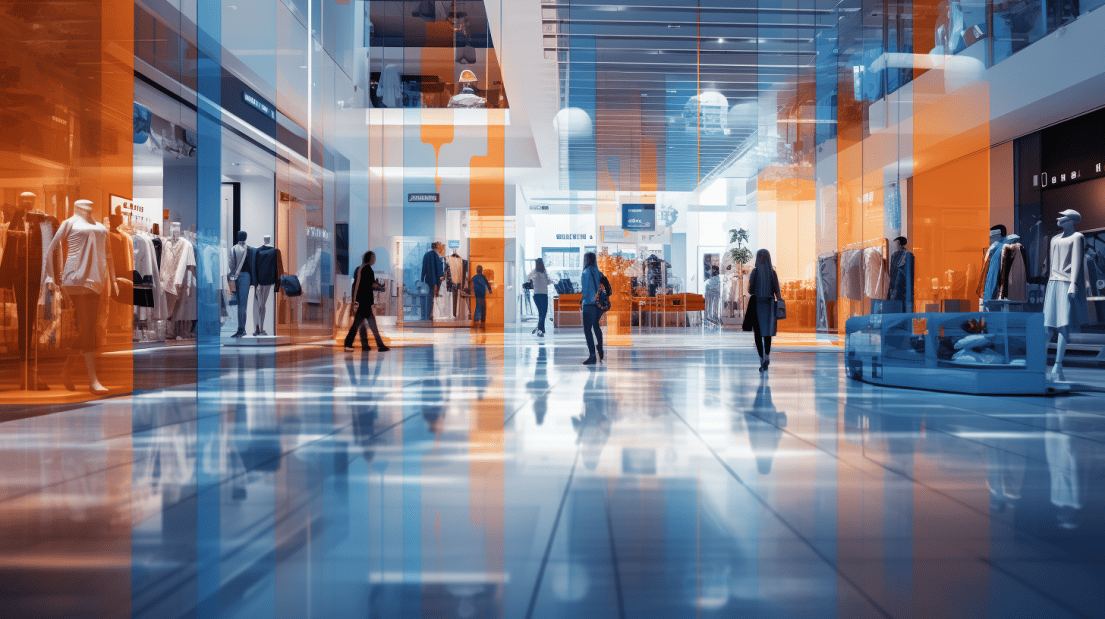
The world of retail sales has become increasingly complex, with channels and mediums blurring and consumer behaviors evolving rapidly.
With our Category Management Solutions, uncover emerging behavioral trends of shoppers nationwide, evolving store footprints and channel-specific technologies, and deep insights into channel performance for more accurate and precise benchmarking.
VideoMining’s Behavior PanelTM captures anonymized data from leading retail chains across the U.S., providing essential insights into the state of the industry and the evolving shopper trends, pinpointing opportunities that are most actionable for you.
Extract essential intelligence from evidence-based insights specific to your channel to revolutionize the way you benchmark, evaluate performance, and plan for future growth.

With our solutions, retailers find a highly objective and scientific approach to retail analytics, with concrete evidence to support meaningful category growth.
With these insights, build category toolkits and best practice guides across all essential disciplines, such as planogram optimization, space allocation, traffic flow and adjacencies, promotional strategies, and more.
With patented analytical models to measure Brand Stability and At-Shelf Win Rate, uncover specific roles that brands, including store brands, play in consumer choice and prepare the right strategy for your private label brands.
Ground your JBP processes in an evidence-based and collaborative approach to achieve mutually beneficial category growth.
Enable data-driven decisions that are designed intuitively to meet shopper needs and expectations. Launch Behavior Labs Test & Learns to collaborate, ideate, experiment and optimize.

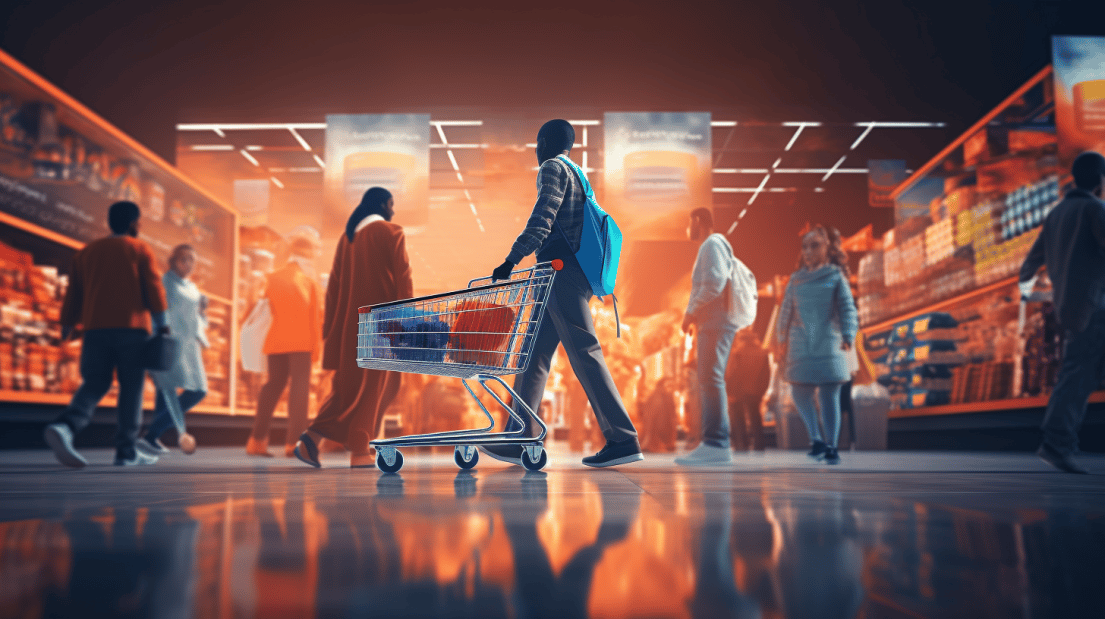
Shopper Marketing : Our Offerings
VideoMining’s AI sensors capture essential information about every shopper who steps through your doors, including group dynamics, demographics, and behavioral clusters.
With this primary data set integrated into any other available shopper data, we unlock expansive insights into the dynamic profiles of your shoppers.

Design marketing campaigns and build empathy for the shopping experience by 'walking in the shopper's shoes'.
Ground your shopper marketing programs with an empathy-driven intelligence that understandings the nuances along each micro-moment leading up to the moment of choice.. Uncover winning combinations of programming, placements, ad copy, category adjacencies, promotions, and more by dissecting the shopper decision making process step-by-step.
Observe each shopper's individual journey in the store, paying close attention to their behavioral response to every piece of stimulus they encounter - from the displays they walk by, the products they examine, the items they consider, and the items they search for but abandon their quest.
We uncover a variety of paths that shoppers take, and we use AI-powered behavioral science to determine the right moment to intercept them with targeted messages and offers that inspire action.

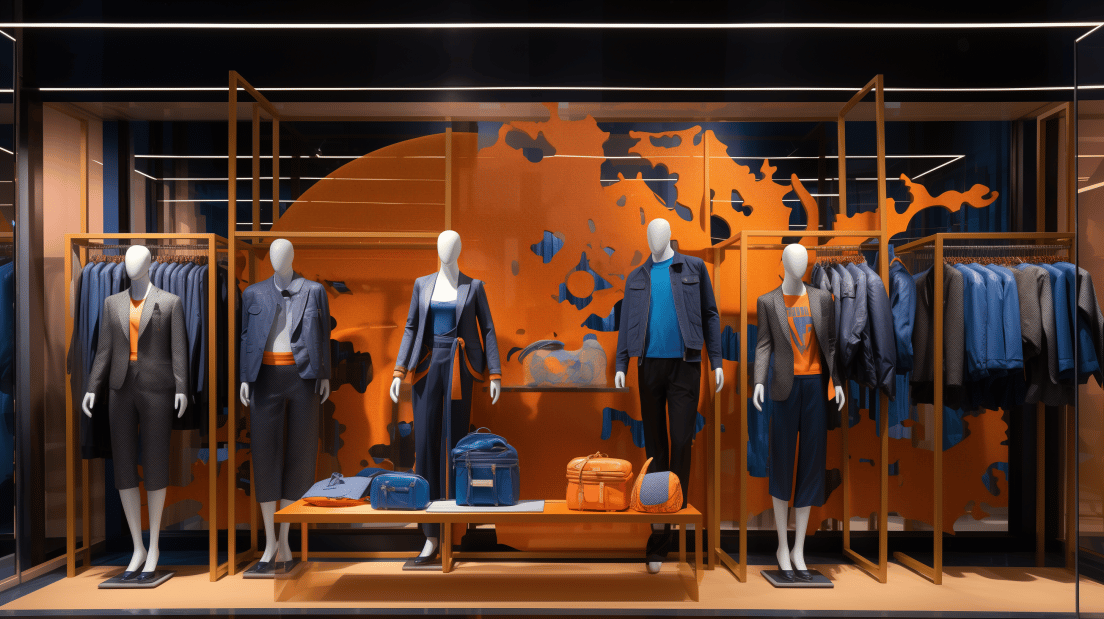
Leverage VideoMining's cutting-edge computer vision technology to maximize your limited secondary display placements in-store. With over 500,000 displays analyzed, our technology has generated detailed industry-wide benchmarks and best practices that can help you craft the perfect plan.
Our patented technology and expansive test and learn capabilities enable you to identify under-performing displays, pinpoint the most effective secondary display locations, and evaluate the efficacy and productivity of each brand and product category that you grant incremental real estate on your floor.
Retail marketers must create cohesive campaigns that encompass all aspects of the buyer's journey, linking together to establish a bond of understanding, thoughtfulness, and trust.
In order to simplify the inherent complexity in retail analytics, retailers can develop potent campaign analysis tools that provide a holistic view of the customer's journey and unlock the most effective equation for successful shopper marketing campaigns.